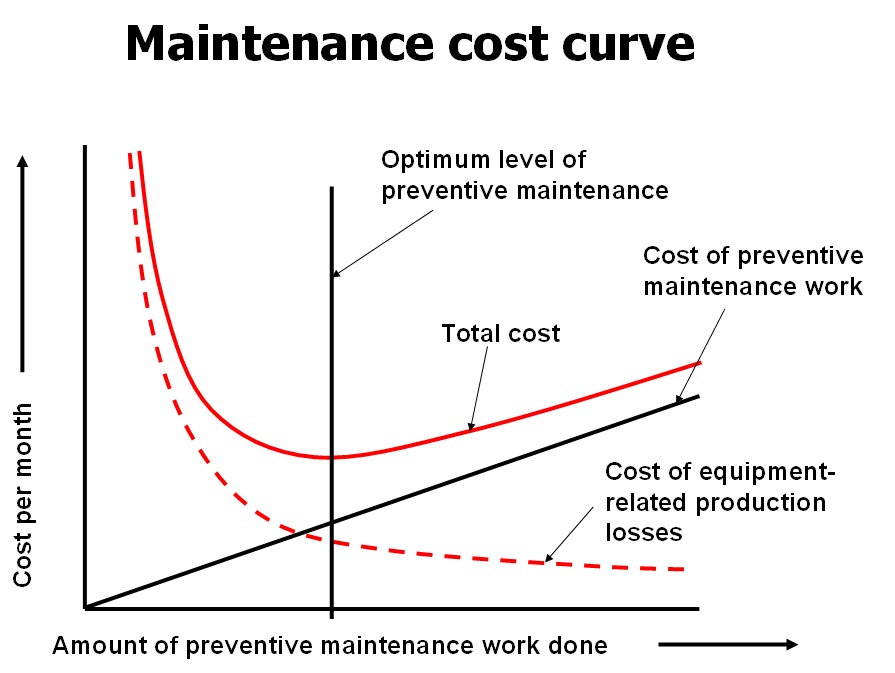
Its obvious that too much money can be spent on maintenance, and it is also obvious that no maintenance at all is not enough, so it stands to reason that somewhere in between there is a “right amount” of maintenance in any operation. The trick is to find where the optimum amount of maintenance is, and which side of that optimum you are on at any time. Fig 1 shows that the optimum level of preventive maintenance occurs when the sum of the cost of PM plus the cost of the production losses that occur as the result of problems which could be avoided with good PM is at a minimum. Many other aspects of maintenance also have an optimum point, including Maintenance storeroom inventory.

Fig 1

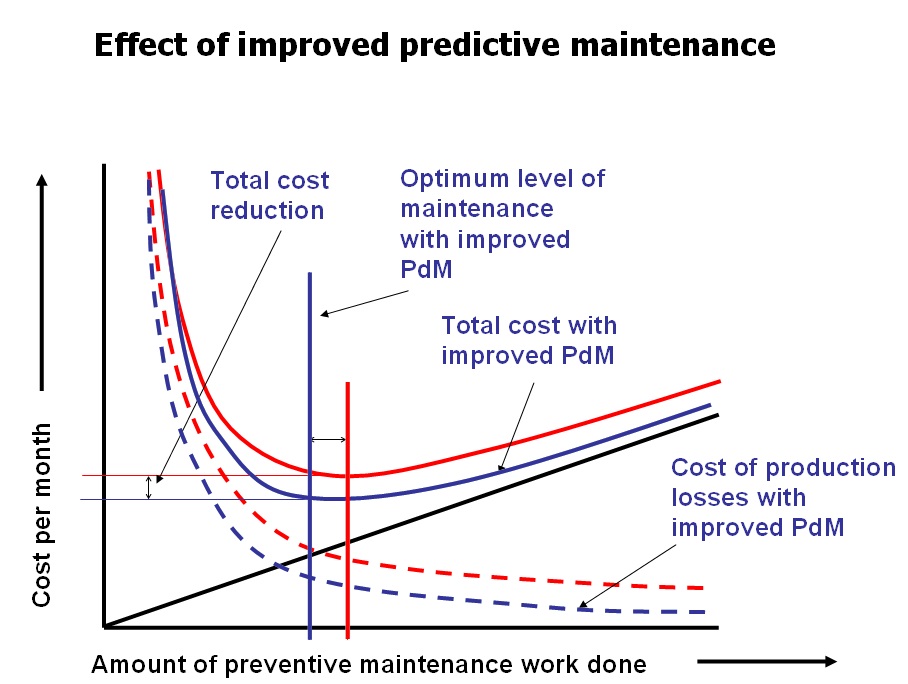
Fig 2
This concept of optimum maintenance is always just that, conceptual. It is impossible to plot this graph (e.g. by deliberately increasing and decreasing the amount of PM work done) because the effect of changing the amount of PM done may take a long time to become apparent, and because in that time too many other changes, such as capital projects, will impact plant reliability enough to mask the effect of the change in PM effort.
However, it is of value to be aware of the concept of optimum maintenance.
The optimum point can be changed by increasing the effectiveness of the maintenance effort. Fig 2, again conceptual, shows that improving predictive maintenance can reduce the cost of PM and also reduce downtime losses. Similar families of curves can be shown for improved maintenance productivity, and any other changes in Maintenance.
Click here to return to the articles list
Management is getting people to do what you want them to do.
Leadership is getting people to want to do what you want them to do (dsa).
© Veleda Services
Don Armstrong, P. Eng (retired)
President, Veleda Services
dsarmstrong@shaw.ca
250-655-8267 Pacific Time
